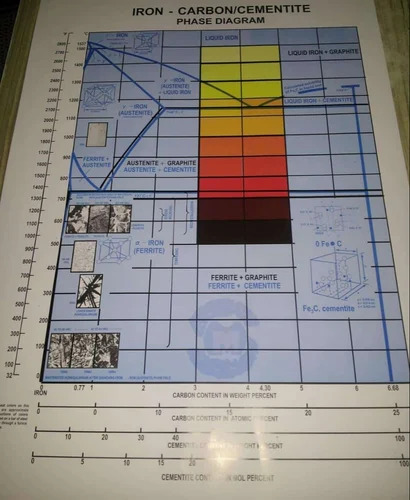
About Iron Carbon Phase Diagram Chart
The Iron Carbon Phase Diagram Chart is an essential tool designed for industrial applications, aiding professionals in understanding the relationship between iron and carbon content. Crafted from durable paper, this chart offers precise data with an accuracy of 1.0%, ensuring reliable results for critical processes. The chart features a clear LCD display for easy visibility, and its automatic operation enhances efficiency in demanding industrial environments. Ideal for professionals in metallurgy, engineering, and manufacturing sectors, the chart provides invaluable insights into phase transitions and alloy compositions. Its sleek design and robust material make it an indispensable resource for accurate data interpretation and efficient workflow.
FAQs of Iron Carbon Phase Diagram Chart:
Q: What is the accuracy level of the Iron Carbon Phase Diagram Chart?
A: The chart offers an accuracy of 1.0%, ensuring reliable and precise data interpretation.
Q: What type of display does the chart feature?
A: The chart is equipped with an LCD display for clear and convenient viewing.
Q: What material is used to produce the Iron Carbon Phase Diagram Chart?
A: The chart is made of durable paper, designed for industrial usage.
Q: How does the chart operate?
A: It operates automatically, making it efficient and user-friendly for industrial setups.
Q: What industries is the Iron Carbon Phase Diagram Chart suitable for?
A: The chart is ideal for applications in metallurgy, engineering, manufacturing, and other industrial sectors.


 Send Inquiry
 Send Inquiry